 |
| FtDNA myOrigins [FtDNA Email] |
Recently I received an email about the release of FtDNA’s myOrigins; this would replace the old version of the calculations given for ancestry breakdowns. I was pretty excited about this upgrade because it would add another view of my ancestral breakdown by another company. Currently I have 23andme’s Ancestry Compositon as well as Ancestry’s AncestryDNA. I have also used DNATribes for myself and a couple of other family members. So let’s take a look through a Puerto Rican lens of the myOrigins release!
 |
| 23andme Ancestry Composition |
For comparison’s sake let’s look at my 23andme Ancestry Composition. Here on the left is what my percentages look like in Standard View. I go back and forth between the Standard View and Speculative View, but for this comparison sake let’s stick to the main one. You can see that in solid, raw numbers I am approximately: 54% European, 15% Sub-Saharan African, 12% East Asian/Native American, 1% Middle Eastern/North African, and 18% Unassigned. I don’t like the large amount of unassigned here in Standard View but we can’t live in a perfect genetic genealogical world (Not yet at least!).
 |
| FtDNA myOrigins |
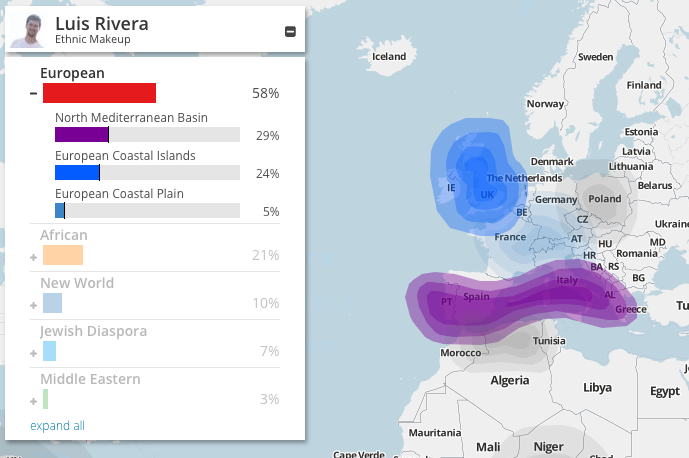
Now take a look at my recently released myOrigin percentages! There are definitely a few similarities and some differences. Here on myOrigins you can see that I am slightly more European at 58%, which is only a ~4% difference from my Ancestry Composition. My African is listed as 21%, a good ~6% higher than 23andme. The Native percentage called here “New World” is a solid 10%. Here on myOrigins there is a Jewish Diaspora breakdown where I score 7% and then a Middle Eastern group where I score 3%. On AncestryDNA I do score 5% on their category of “European Jewish” but 0% on their “Middle East”.
The categories can then be expanded to show a more in-depth look at the main category. For example, my European breaks down into: North Mediterranean Basin, European Coastal Islands, and European Costal Plains. My African breaks down into: Niger-Congo Genesis, and East-African Pastoralists. While my Middle Eastern breaks down into: North African Coastlands (Which if you look at it that way I score a 4% on AncestryDNA). Here are the pictures of the breakdowns for my main categories. Note: New World is Bering Expansion which covers North, Central, and South American while the Jewish Diaspora hovers/radiants over and near Poland.
 |
| European Ethnic Makeup [FtDNA myOrigins] |
 |
| African Ethnic Makeup [FtDNA myOrigins] |
 |
| New World Ethnic Makeup [FtDNA myOrigins] |
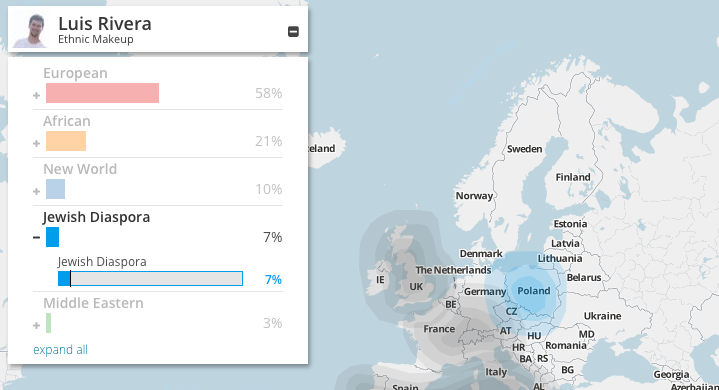 |
| Jewish Diaspora Ethnic Makeup [FtDNA myOrigins] |
 |
| Middle Eastern Ethnic Makeup [FtDNA myOrigins] |
It was definitely interesting looking at these numbers especially at the African and European scores. My African on myOrigins is at 21% while on AncestryDNA it’s at 23%, the highest 23andme places me is at 15.7%. Also AncestryDNA predicts that 12% of my DNA is from the Mali region and here on myOrigins 17% of it is labeled as “Niger-Congo Genesis”. I was also surprised that I scored 24% on the European Coastal Islands portion and I wonder if that has anything to do with the potential connection through Gustave Jean-Charles and also potentially through my great grandfather’s Irish/English paternal haplogroup.
All in all, I didn’t think the ethnic breakdown was too far of from what I have seen with other companies. Whether or not it’s true to my family is a completely different story! Since my family is pretty mixed for the last past 200+ years I don’t really know where certain parts of Native, European or African come from — rather it’s coming probably from all my lines. I can only guess that my 4th great grandmother was 100% African because she was born on a sugar plantation in Martinique. I’m really interested to see if myOrigins develops a bit further and adds more specific breakdowns for African like AncestryDNA has done.