
While browsing my 23andme profiles recently with a new update*, I noticed that various of my profiles would not be receiving said update given how long ago many of my tests were taken. I decided to check out when exactly they were taken and I noticed that some were as far back as 2011! Since my maternal grandmother was visiting from Puerto Rico and she had one of the oldest tests, I decided to update her DNA test since my mother could help her retake it.
*Many of profiles have continued to receive updates throughout the years, but some of the most recents updates that are occurring on v5 have not occurred on these older profiles.*
Since I was in France I was not in a rush to get the results but luckily by the time I left France and returned to the US, I only had to wait about 2 weeks for the results to come in. Below, I compared the information from April 2011 and June 2023, showing the increases and decreases in percentages as well as new categories my maternal grandmother received in her DNA testing. I broke the results down into the larger ethnic groups so that I could easily process the information.
Let’s see how my grandmother’s results have changed now that she is on the v5 chip!
European results
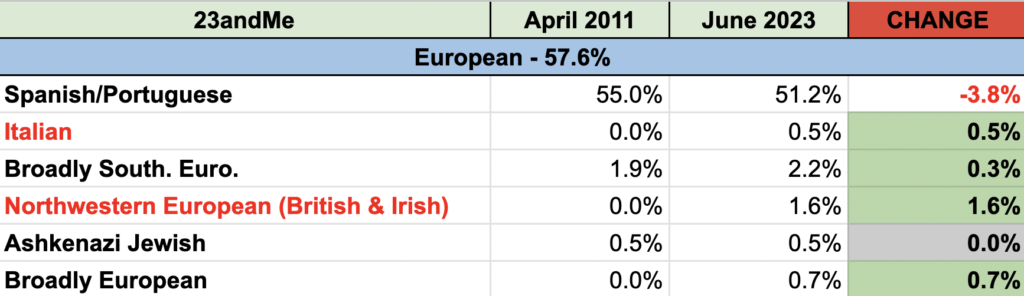
In the European category, we can see that my grandmother received two new groups: “Italian” and “Northwestern Europe” (specifically identifying British and Irish and within that category the country of ‘England’ itself). Her “Spanish and Portuguese” took the biggest drop at -3.8% change, with 1.6% of that rising in “British and Irish”. The other categories went up by 0.___% amounts, levels which I would mainly consider noise. The Ashkenazi Jewish percentage did not change which was interesting to see as well.
Her top regions in Spain are 1. Canary Islands, 2. Galicia, 3. Asturias, 4. Andalucía, and 5. Castile and León – However, I am not sure if these regions changed with the recent update.
African Results

This is one of biggest groups, which considering the ethnic mix of slaves in the New World is not that surprising to me. My grandmother was assigned one new group, “African Hunter-Gatherer”, and most groups deceased by small percentage amounts. Nigerian rose by 2.1% which I found interesting, not for my grandmother but if not taking into consideration my maternal grandfather’s results. My maternal grandfather has the highest Nigerian percentages in my family, unfortunately, since my grandfather has passed I will not be able to upgrade his test and see how if and how his percentage would have changed.
“Nigerian” is now almost up to par with “Senegambian and Guinean” totally about close to 10-11% of the 23.5% total. While “Congolese and Southern East Africa”, “Angolan and Congolese” take up another huge chunk at about 11-12%. I imagine all the small percentages such as “Northern East African” or “African Hunter-Gatherer” are from internal immigration and mixing across the continent.
One percentage did not change which was “Northern East African” at 0.2%. To date, no smaller ethnic groups have been assigned within the country categories for my grandmother yet. This is one of the main reasons I wanted to get her updated, just in case this becomes more nuanced and easier to identify in people from the New World, descendants from slavery.
Indigenous American Results
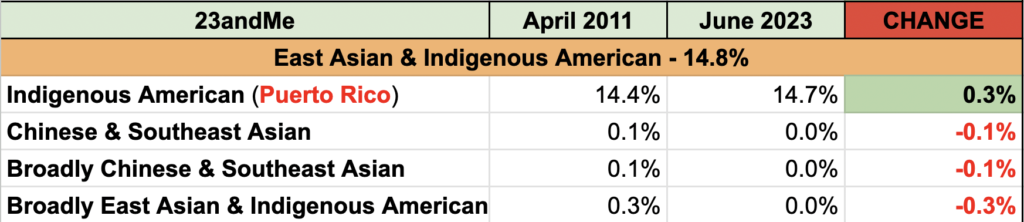
This category did not change much which is exciting to see that after all of these years the percentages are fairly similar or “correct”. The biggest change is that now the Indigenous American is labeled as “Puerto Rico (indigenous)”. The group only increased by +0.3% and all of the other groups completely disappeared from my grandmother’s results.
Western Asian/
North African Results
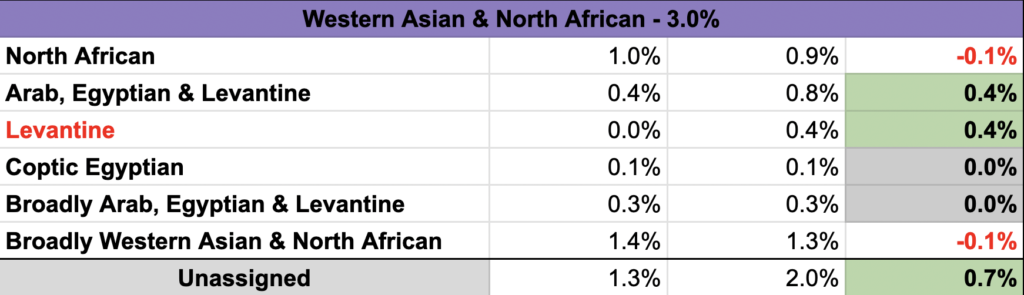
The final group is Western Asian and North African along with unassigned. The groups increased at small percentages, while a new assigned group called “Levantine” increased by +0.4% along with “Arab, Egyptian & Levantine”.
The unassigned group also increased by +0.7% to bring it to 2% – which is honestly almost nothing. Two “broad” categories “Broadly Arab, Egyptian, and Levantine” and “Broadly Western Asian and North African” did not change.
COnclusion
Though there were no big “shocks” in my grandmother’s update and I am happy I was able to get her on the new chip. My hope is that as African ethnic groups identities become better, she (along with other family members) will be able to be assigned groups within modern country borders such as Nigeria, Angola & Congo, Senegambia and Guinea, etc.
My goal is to continue updating the older profiles so that as the updates keep rolling in these profiles will be able to benefit from them as well. My own DNA profile is from 2011 as well but I am focused on the older family members I have alive who can currently test!